Here are the numbers that explain the World Cup group stage
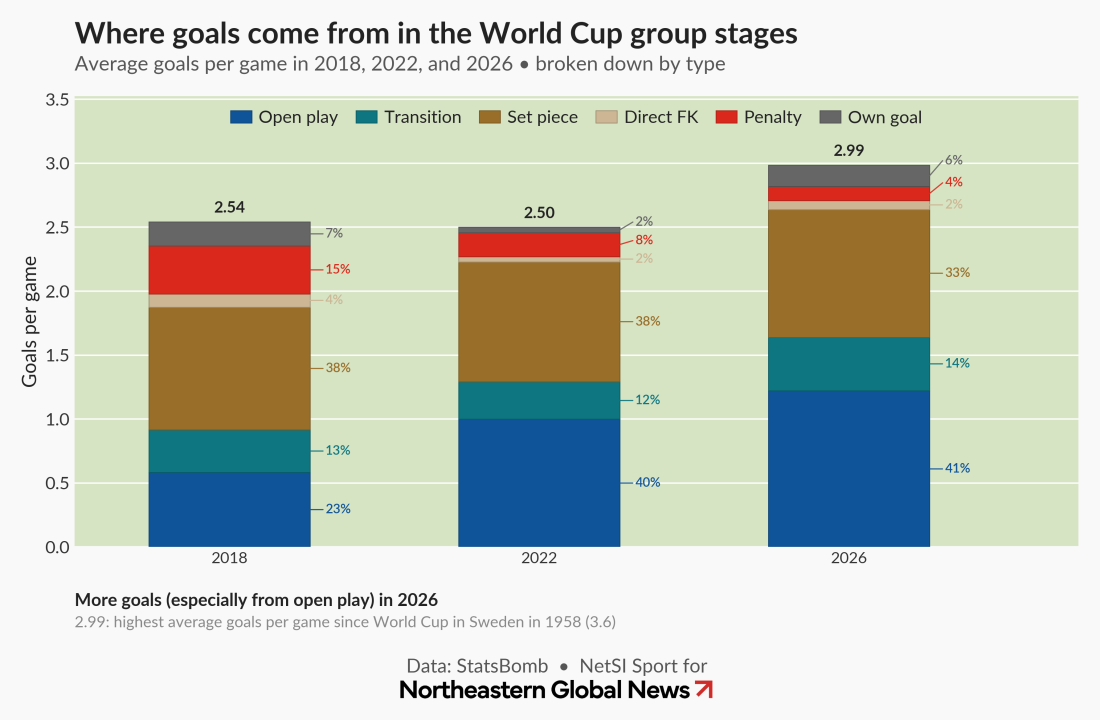
Overall, the number of goals scored per game in the group stage increased significantly this year — 2.99 goals in 2026, the highest rate since 1958.


The 2026 World Cup group-stage is complete. Now, the tournament turns to the knockout round — win or go home — beginning Sunday afternoon.
The top scoring teams all advanced to the knockout round of 32. France, Germany, and Netherlands tied for the most goals in the group-stage with 10 goals each. Argentina, the United States, Canada, Norway, Senegal, and Brazil were next with each team securing eight goals.
Overall, the number of goals scored per game in the group stage increased significantly at this year’s World Cup — 2.99 goals in 2026, compared to 2.5 goals in 2022 and 2026. This year represents the highest average number of goals scored per game since the 1958 World Cup in Sweden.
One explanation for the scoring increase is the field expanded to 48 teams this year, leading to more matches between higher- and lower-ranked teams. But that doesn’t tell the whole story. Another factor is that top players converted low xG shots — shots with a lower probability of scoring — more often than in previous years. This trend led to higher scores, and more exciting matches.
Editor’s Picks


The bar chart below breaks down what types of plays resulted in goals over the past three World Cups in the group stage. Notably, 1.2 goals were scored this year in open play (the blue section of the graph) — as a team is deliberately and tactically moving the ball up the pitch to find a way to score. These types of goals accounted for 41% of the scores in this year’s group-stage, higher than the past two tournaments.
Another factor for the higher scores was a higher share of goals coming from transition (the teal section of the graph), or when a team regains possession. Lower-ranked teams like South Africa and Cape Verde benefitted from counter attacks, where they regained possession and quickly moved the ball up the pitch with longer passes.
Open-play goals, where a team scores during normal active play and not as the result of another scenario, such as a penalty kick, accounted for the largest share of scores per match. And teams’ style of play often dictated how these open-play goals were scored and which teams advanced.
The graphic below shows teams’ average possession and average length of pass. Teams that controlled possession – that is, had the ball for more time than their opponent — and relied on shorter passes to build their attack up the pitch — overwhelmingly advanced to the knockout stage. These teams are represented in the bottom right quadrant of the graphic.
Read more World Cup analysis on NGN Offside →
Spain, which finished the group stage with two wins and a draw, held the ball 68% of the time — the highest percentage of any team in the tournament.

Data analysis provided by Brennan Klein, director for Northeastern University’s NetSI Sport research group.