Seeing Science

The library has an awesome new exhibit up called “Places & Spaces: Mapping Science.” They’ve got dozens of maps describing a variety of scientific concepts and trends, like one spider web of connections between scientific disciplines and a crazy topographical visualization of patent patterns across the globe.
This is a particularly interesting concept to me because it gets at the heart of science communications from a totally different angle than I’m used to (writing). The idea is to provide visual context for some complex scientific concepts. I believe that one of the most important challenges scientists face is getting their message out in an accessible way to the general public – that is, all of us who will some day be affected by the work. This exhibit provides yet another platform with which to achieve that goal – it’s infographics brought to a totally new level!
Northeastern Professors Alessandro Vespignani and Albert-László Barabasi, along with visiting researcher Maximilian Schich, all have maps in the exhibit. Schich will give a talk at the Places & Spaces opening reception on Tuesday, February 7th at 4:30pm.
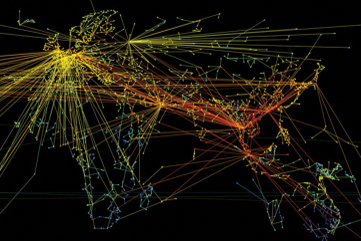
Above is another of Vespignani’s maps which is not in the exhibit but has the same goal as the rest of them: to help us see, and thus better understand, scientific data. This one highlights the spread of a pandemic from its origin in Hanoi, Vietnam to 3200 other populations worldwide. While the image is beautiful it’s also horrifying when you really think about what it’s communicating. The map originally appeared in a AAAS perspectives article entitled “Predicting the Behavior of Techno Social Systems.”