Key takeaways from the data of host countries’ first World Cup games
The U.S. and Mexico grabbed wins in their World Cup openers, while Canada played to a draw. Northeastern’s Brennan Klein breaks down what the data revealed.


The United States and Mexico opened the World Cup with victories, while the third host country, Canada, played to a draw.
Brennan Klein of Northeastern’s Network Science Institute said he was impressed by the Americans’ strategy and execution, and the data confirmed that conclusion.
“It was one of the best games I’ve ever seen a United States men’s team play, and there’s a lot of really interesting data to support that claim,” said Klein, who leads the NetSI Sport research team, which is analyzing a host of soccer data throughout the tournament for Northeastern Global News’ blog NGN Offside.
Mexico, meanwhile, played a strong game overall, but Klein said it was difficult to assess the performance because they faced a much lower-ranked South Africa team by FIFA, which was also forced to finish the game with only nine players after two were sent off for receiving red cards.
Canada, for its part, put itself in good scoring chances but couldn’t capitalize, he said, and also implemented a clear strategy for throw-ins near the opponents’ goal.
United States
First match: defeated Paraguay, 4-1
Next match: vs. Australia, Friday, 3 p.m. EDT
Klein said the United States was much more willing to engage the defense than in years past, rather than settle for more conservative passes. Defensemen Chris Richards and Tim Ream were crucial to starting the United States’ attack throughout the game, and overall the U.S. was much more aggressive in its dribbling and passing up the pitch. For example, the U.S. had 35 attempted dribbles, compared to an average of 11.7 over their previous seven competitive games. Similarly, it had 24 completed dribbles, compared to 7.4 on average.
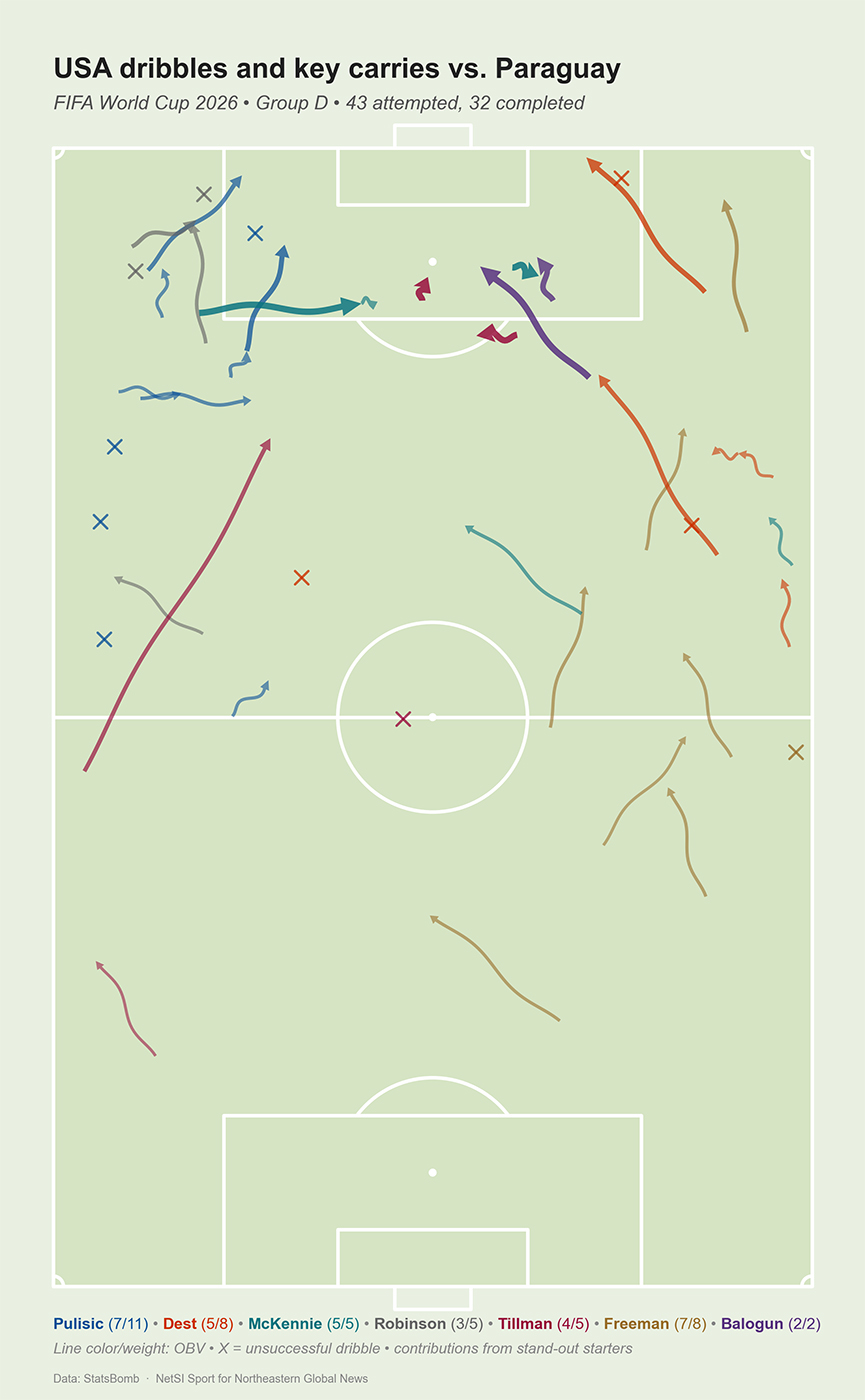
This higher-risk, higher-reward strategy led to more scoring chances. However, Klein warned that the U.S.’s next opponent, Australia, could take advantage if the U.S. plays the same style. Australia boasts a fast squad, with three players — Jordan Bos, Mohamed Toure and Cameron Burgess — among the top 15 players with the highest recorded speed through the tournament’s first 12 games (see graphic below). Bos, for example, hit 22.8 miles per hour.
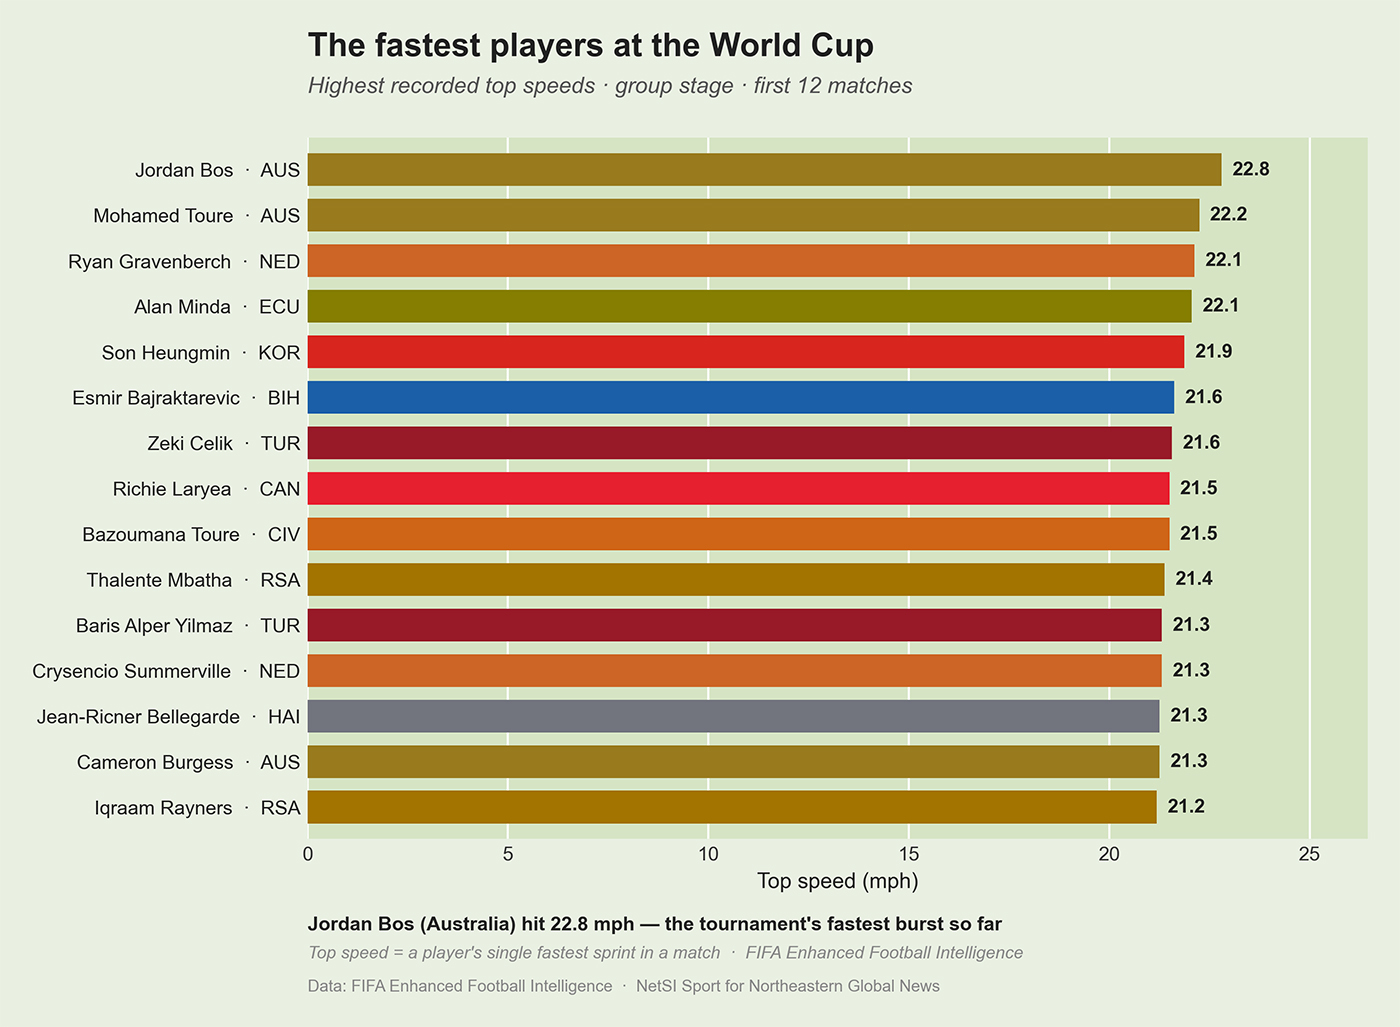
Australia’s team speed led to counterattacks that helped propel Australia in its 2-0 victory over Turkey in its opener.
Mexico
First match: defeated South Africa, 2-0
Next match: vs. South Korea, Thursday, 9 p.m. EDT
Mexico limited South Africa to an extremely low 0.09 xG, expected goals, for the game — a metric that measures the quality of scoring chances. “This means [South Africa] hardly created any opportunities, and struggled with Mexico’s attack,” Klein said.
Read more World Cup analysis on NGN Offside →
Klein said Mexico dominated the action, deploying a high-pressure scheme against South Africa. This is a strategy to watch against a stronger opponent in South Korea.
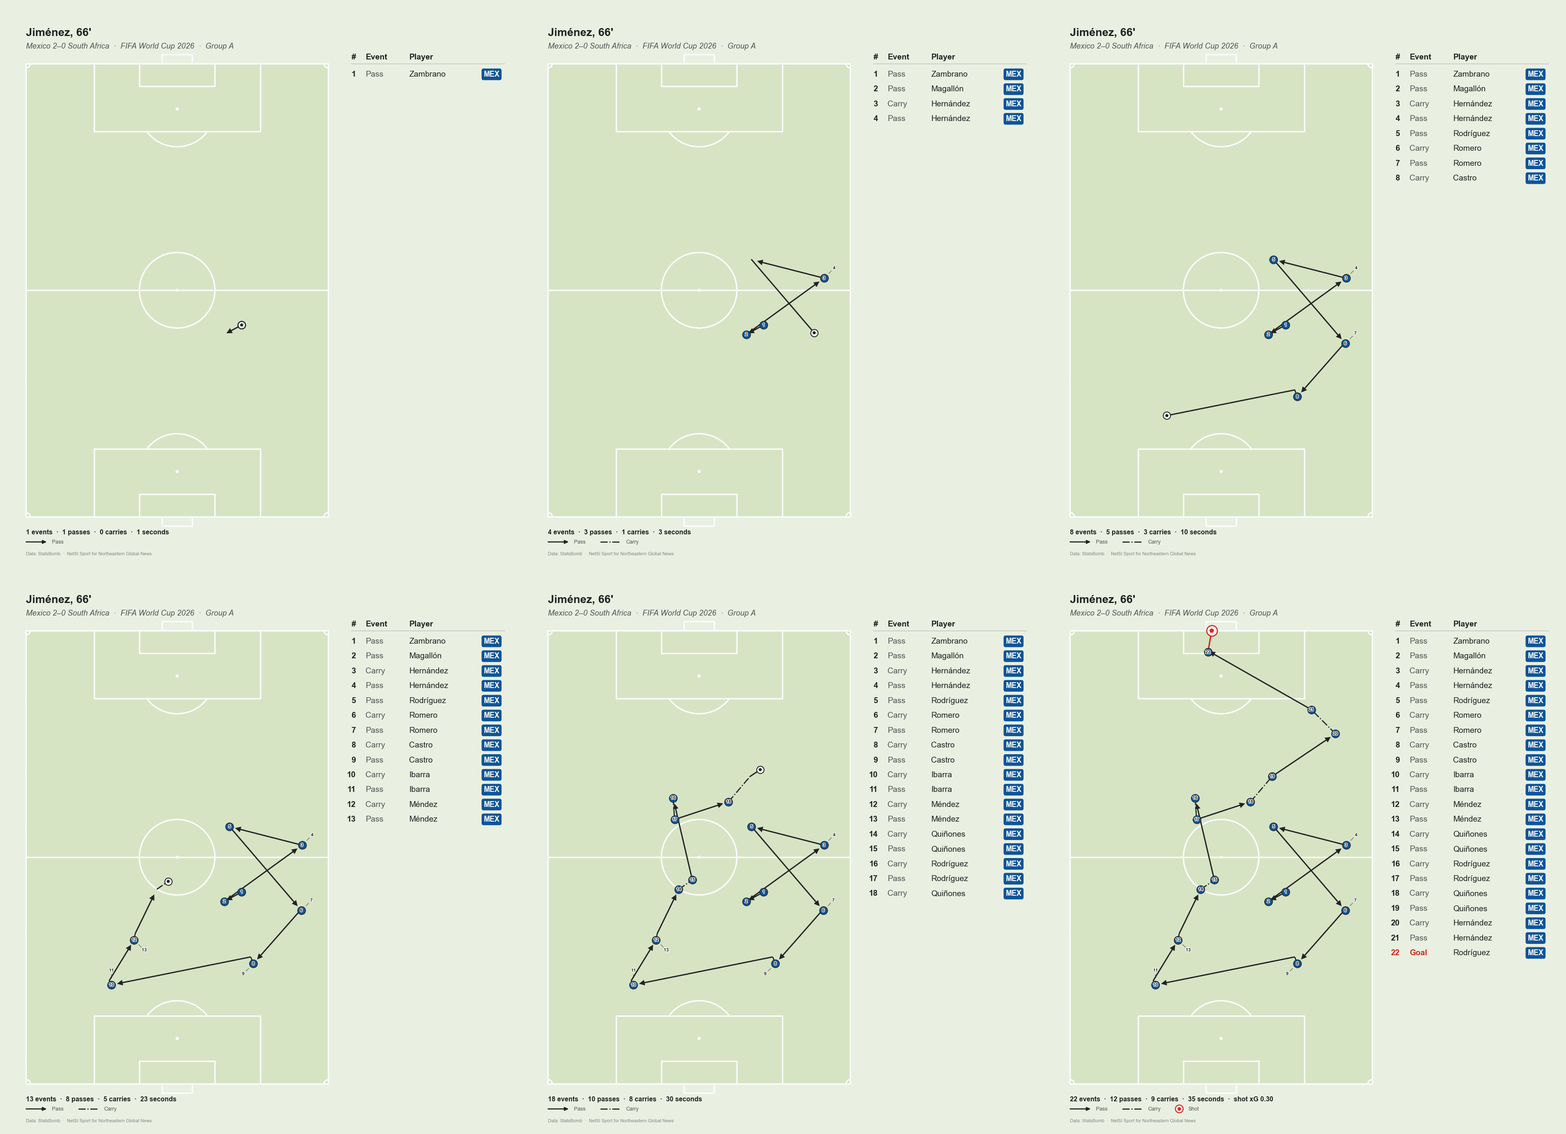
One of the most exciting moments of Mexico’s match with South Africa was striker Raúl Jiménez’s emotional goal. Jiménez suffered a life-threatening skull fracture in 2020 when he and an opponent collided heads as they jumped for the ball. Klein said Jiménez has been a pinpoint header over his long career, and that’s how he scored in Mexico’s opener — off a beautiful pass behind the defense. See the graphic below for the sequence of events that led to the goal.
Canada
First match: draw with Bosnia-Herzegovina, 1-1
Next match: vs. Qatar, Thursday, 6 p.m. EDT
Klein observed a few trends from Canada’s first match to watch going forward. For one, the Canadians relied quite a bit on crossing the ball from the wings into the scoring box. They had several strong scoring chances, but failed to capitalize. “They could’ve done much better with their shots,” he said.
Another interesting strategy is that when they got into the lower third of pitch — i.e., the section of the field closest to the opposing goal — Canada attempted several long throws toward and into the scoring box that resulted in some high-value chances. This strategy, he said, is becoming more common in international play.
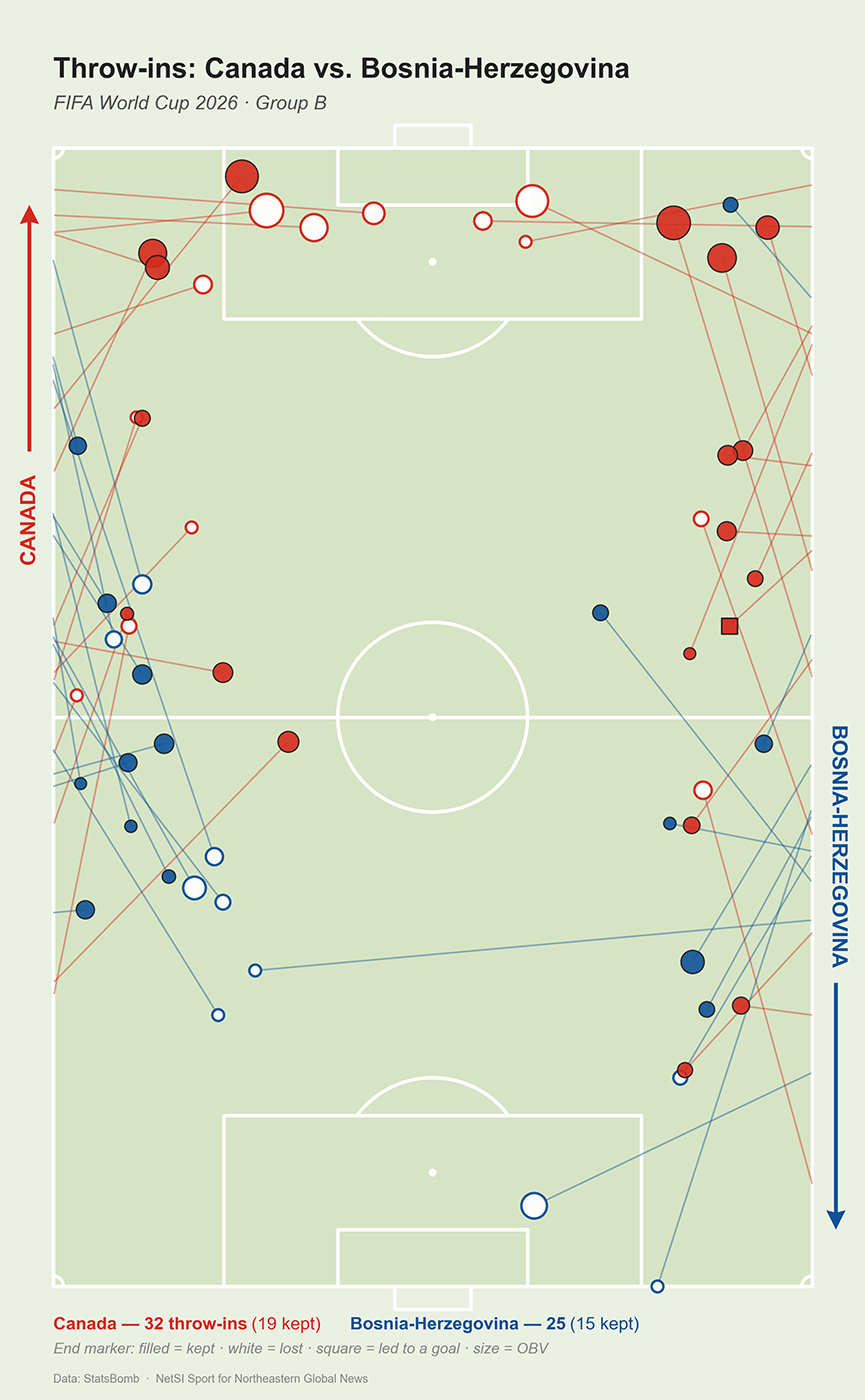
“I think Qatar and Switzerland should be prepared for Canada’s long-throw strategy,” Klein said.


