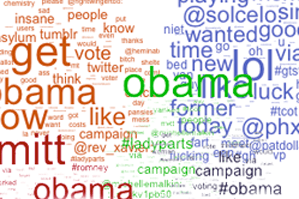
Data for the debates

Sixty million people are expected to tune in on Wednesday night to watch the first presidential debate of this election season. While the debates themselves may not determine the outcome of an election, the voters watching them do.
So, wouldn’t it be nice if we could crawl into the minds of those voters and catch a glimpse of their collective thoughts during the debate? How will they respond when the candidates talk about gun control 15 miles from the site of this summer’s tragic movie-theater shooting? How will they react when Mitt and Barack tout their plans for pulling the economy out of recession once and for all?
Or forget about responses, what if we could tell what the voters actually wanted to hear about in advance?
A real-time data visualization tool from professor David Lazer‘s lab will allow us to do just that…without any of the gory or scientific challenges that go along with getting inside another person’s brain. Beginning around 3pm on Wednesday, it will be viewable online here.
Following the Twitter feeds of three so-called focus groups, the visualization will give a real-time picture of what the viewers are thinking. But while your standard focus group might contain a couple dozen people, these will each have 2500.
Lazer’s team, which includes research professor Yu-Ru Lin who led the effort, research assistant professor Mauro Martino and post-doctoral researcher Drew Margolin, identified Tweeters who were active in the political conversation on Twitter by tracking their activity during the convention speeches or tweeted to the CSPAN convention hashtag during the conventions. Since they were likely watching the convention and talking about it, the team expects they will also be watching the debate. The groups fall into three categories: people that tweeted actively during both the republican and democratic conventions and people that tweeted during one or the other. The visualization will be a dynamic graph ebbing and flowing with the total number of tweets from each group. A subset of those tweets will be available to read.
Additionally, the team will be tracking the volume of frequently used words for each of these three groups and will have updated tag clouds every ten seconds showing what the people are talking about specifically.
Be sure to check it out while you’re watching the debate for a real-time analysis of your fellow voters’ reactions.


