The journey of a disease

In an effort to visually represent just how easily a disease can spread across the globe, researchers at Northeastern’s MoBS Lab looked to a mode of transportation that makes it relatively easy to get around: a subway system.
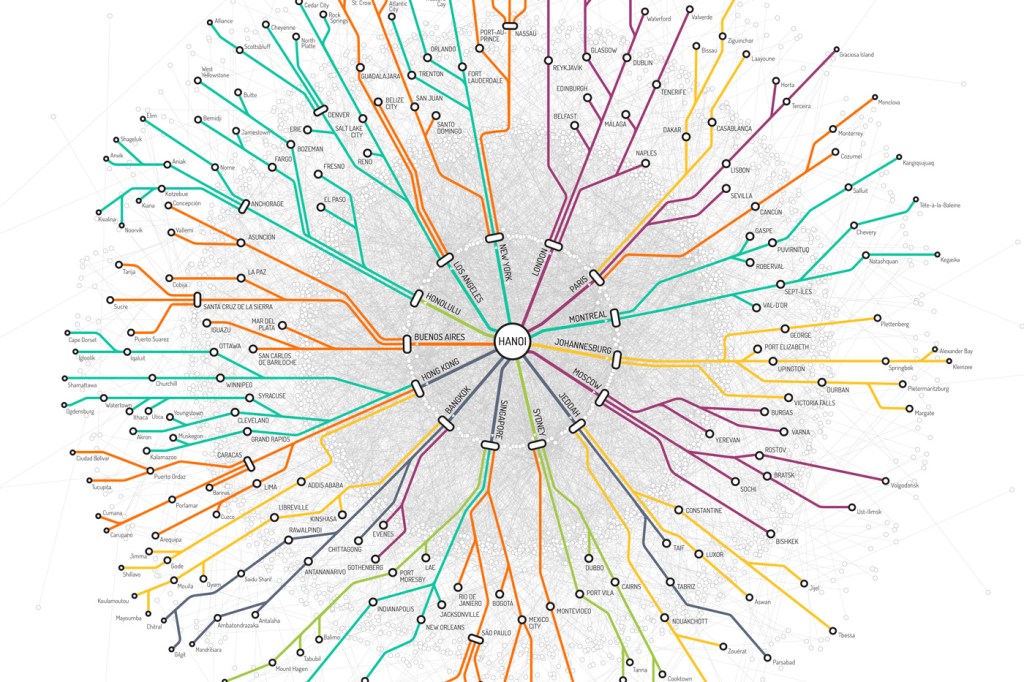
They created the Epidemic Rapid Transit Map, which uses a subway map to show how a hypothetical pandemic originating in Hanoi, Vietnam, can quickly spread to other major cities and remote areas alike. Once the disease reaches metropolises such as Paris, New York, and Hong Kong—which serve as transfer stations on the map—it can spread to other destinations like Dublin, Mexico City, and Denver.
“What we want to highlight here is that you cannot hide from the disease,” said Ana Pastore y Piontti, a postdoctoral research associate who worked on the project. “Wherever you are in the world basically, as long there is a connection to the rest of the world, you can always get the disease.”
The MoBS laboratory—directed by Alessandro Vespignani, the Sternberg Family Distinguished Professor of Physics, Computer Science, and Health Sciences—works to develop innovative mathematical models and computational tools to better understand, anticipate, and control large-scale complex networks and systems.
The researchers created the Epidemic Rapid Transit Map using the Global Epidemic and Mobility model, which combines real-world data population and human mobility data in order to predict the global spread of diseases. Vespignani and his team built this computational model, called GLEAM, which counts more than 3,300 census areas in about 220 countries.
For this project, the researchers replicated the same disease transmission parameters as Vespignani’s team used to track and model the 2009 H1N1 pandemic. But this time around, they sought to visualize this hypothetical pandemic in a new way.
“We tried to use a different format than we have in the past,” explained Nicole Samay, the project’s graphic designer. “We styled it like a subway map so more people could better identify with the information.”
The map will be on display at the New York Hall of Science starting Thursday. It will be featured as part of “The Art of Networks II” exhibition during the sixth Workshop on Complex Networks, an annual gathering of international researchers and practitioners working in areas related to complex networks.


