Northeastern student launches site to track traffic in NYC after congestion tax goes into effect
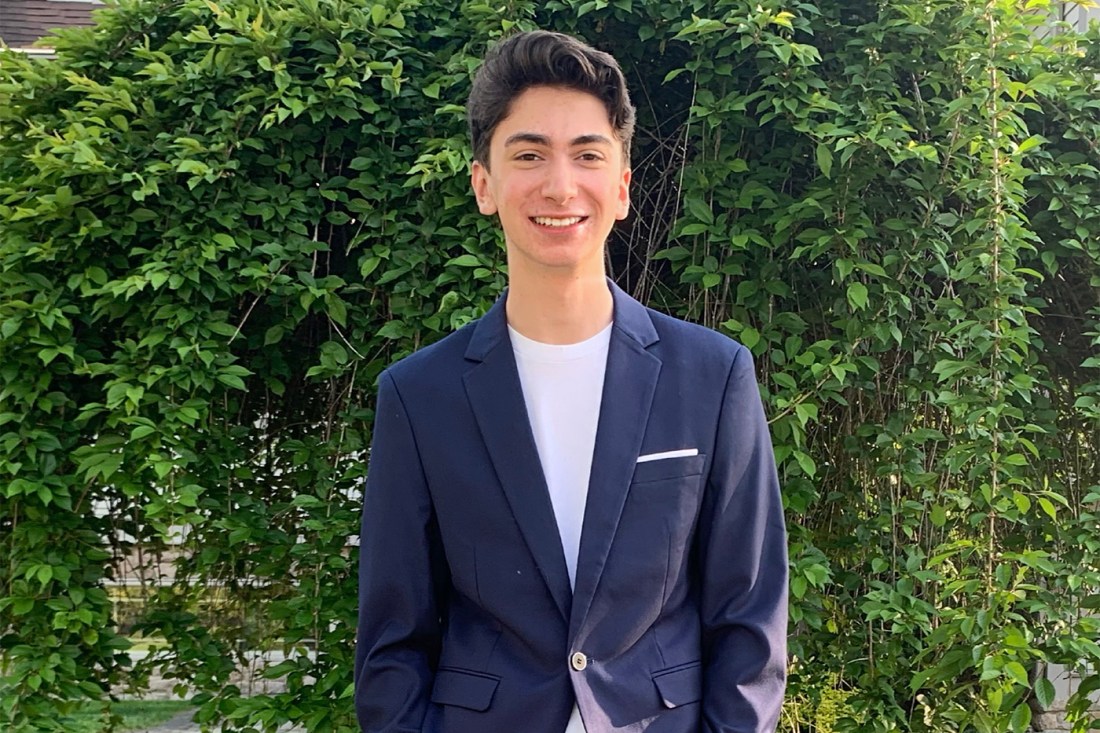
The data Joshua Moshes is collecting on traffic times could help gauge whether New York’s congestion pricing — the first of its kind in the U.S. — will reduce the volume of drivers.

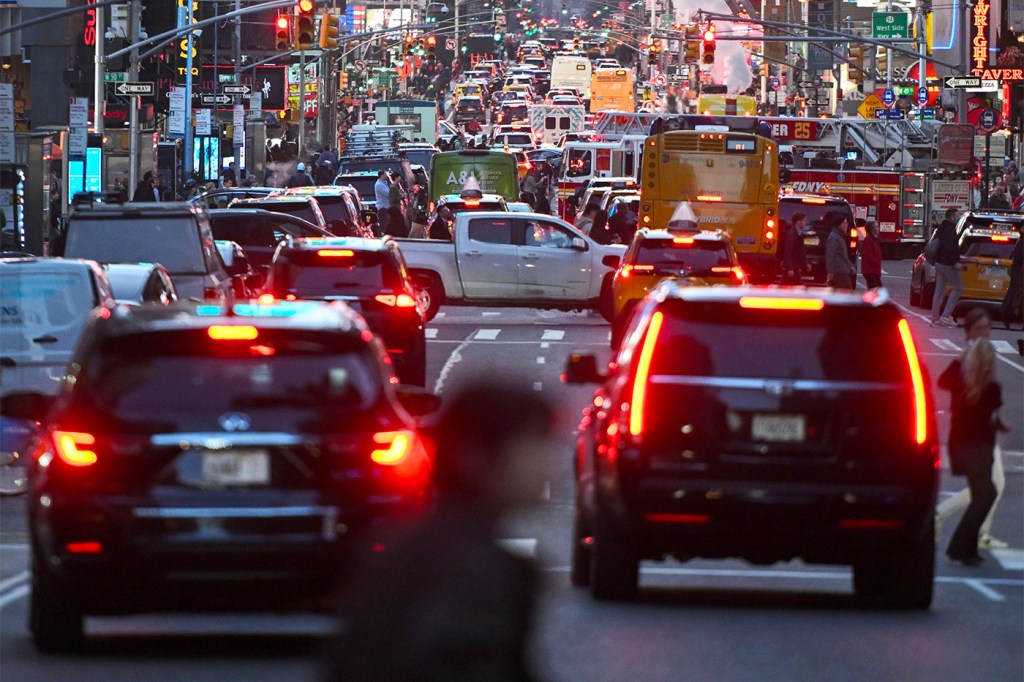
All eyes are on New York City after it became the first city in the United States to implement congestion pricing.
Drivers entering parts of Manhattan on weekdays between 5 a.m. and 9 p.m. and between 9 a.m. and 9 p.m. on weekends are being charged a fee. A lower fee is paid during off hours.
Many are watching and waiting to see if the charge successfully reduces traffic in the city as intended. One way to measure this is through raw data on traffic times. Northeastern University computer science student Joshua Moshes developed a method to collect this information.
Moshes and his brother, Benjamin, built a website that tracks traffic in several key routes into Manhattan, as well as Chicago and Boston, to see if the tax has affected New York City traffic. The site also shows predicted traffic times for a particular route depending on the day of the week and compares the times to before and after the charge.
The site is still in its infancy but its accompanying data has already been cited by news organizations including The Economist and the opinion section of the New York Times.
“We’re trying to let the data be unbiased,” Moshes says. “We want people to make their own decisions based on what they see from the website. We’ve had so many positive emails from people talking about how they’re in Manhattan and … traffic is significantly down. People are also saying the opposite. (But) we’ve had a lot of positivity coming our way.”
New York’s congestion pricing began Jan. 5. The pricing will depend on the time of day and whether the driver has an E-ZPass transponder, but the daily cost is around $9 for most drivers with the transponder entering Manhattan south of Central Park during peak hours and $2.25 during off-peak hours. Some drivers will pay less depending on the route they took to enter Manhattan.
This fee is charged on top of existing city and tunnel tolls.

Moshes, a first-year student at Northeastern, and his brother began working on the tracker in the spring, when the congestion charge was originally supposed to go into effect.
The brothers began collecting and gathering traffic data through a program they wrote in the programming language Python. The program collects data from 19 different traffic routes every 15 minutes. This data is collected in one database that fuels the website.
Editor’s Picks
Moshes and his brother decided to focus on different routes within the congestion zones to provide a broad snapshot of the charge’s effects in different areas of Manhattan and on different commuter routes.
“We also have control routes in Boston and Chicago just to make sure that nothing weird is happening in Boston and Chicago compared to what is happening in Manhattan,” Moshes adds. “If the controls in Boston and Chicago were going down for whatever reason, we would know that something is wrong with our data or that congestion pricing isn’t doing anything.”
The pair began collecting data through August. They paused when the charge implementation was postponed by New York Gov. Kathy Hochul and then resumed data collection in November when it was clear the charge would move forward.
The site compares this data to the traffic times from Jan. 5, when the charge was enacted. Over time, users will be able to look at the average traffic on any given day and time in the city.
“We’ve been collecting the data for a total of four months,” Moshes says. “Once we have more data, we’ll be averaging days together.”
Moshes said the brothers want the data to speak for itself and for people to make their own conclusions about the effects of the charge from the numbers. That being said, there are some trends he’s noticed within the first week. These are noted on the site.
“We found so far that going into Manhattan … there is a significant decrease,” Moshes said. “But within Manhattan, there isn’t a difference. The more time that goes by, the more we’ll be able to determine if this is a true pattern.”


