How to solve Toronto’s traffic troubles? Start with the data
A research group of Northeastern students, led by assistant teaching professors Yvonne Leung and John Wilder, spent months examining public transit use and traffic on highways around Toronto.

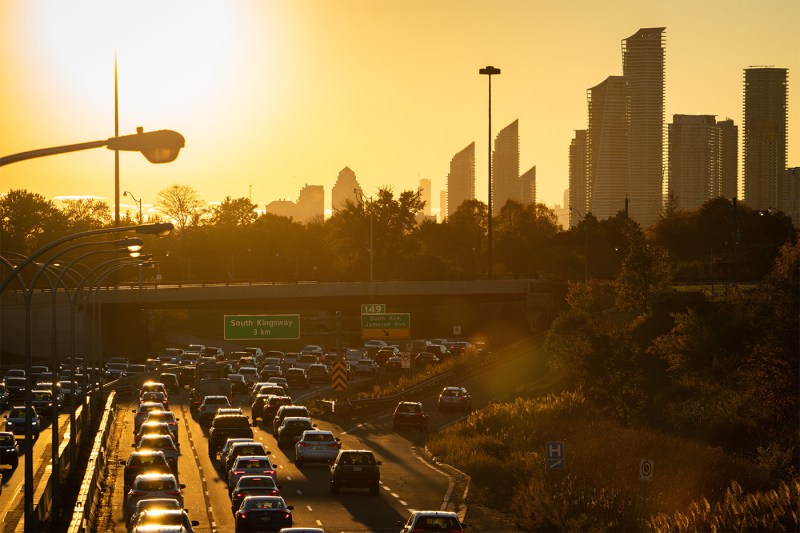
Traffic in Toronto can be troublesome on a good day. But when it comes to events, forget it. It can get so bad that performing pop stars walk to their own shows rather than sit in gridlock.
City of Toronto officials have made it a priority to address this issue. They turned to Northeastern University students for solutions.
A research group of students, led by assistant teaching professors Yvonne Leung and John Wilder, spent months examining public transit use and traffic on highways around Toronto during two major events — Pride Festival and the city’s annual Caribbean Festival over the last few years. They did so using de-identified and aggregated network mobility data from Canadian provider TELUS.
The researchers found that more people were using public transport as the years went on. The breakdown by region allows the city to see what areas are using it most and what areas might benefit from more publicity around public transit options.
Overall, the data confirmed the campaigns around public transit the city is doing so far may be working.
“The results were a five percent increase by 2025,” said Aishwarya Shanmugasundaram, a graduate student in analytics who managed data visualization for the project. “That was with the success of their policies that they have implemented for (getting more) people to use public transit.”
The group spent the summer collecting, cleaning and analyzing the data and creating visualizations for it. They looked at data from Pride and Caribbean fests in 2023, 2024 and 2025 to get a sense of the average attendance and what percentage of those attendees were taking public transport versus driving. They then used geospatial information systems to create a visualization and provide insights on how people were traveling.
The team worked with TELUS to collect cellphone data for specific regions and times and then used that to determine the number of people traveling by comparing the stats from TELUS with numbers from Metrolinx, the government agency managing Toronto’s public transit.
Leung said they focused specifically on people coming in from four regions from around Toronto and on traffic on the day of the event from morning to evening.
The group crafted a system that could output how many users were in a certain area during a certain time frame as well as paint a better picture on the number of people coming and going during these events. They also spoke with attendees of these events to gain further understanding of how people traveled.
They did experience some challenges when analyzing the data, sometimes finding the expected attendance numbers differed from the actual data from TELUS. By working with both parties, they were eventually able to find an accurate estimate.
“Once we clarified, we were able to make sound judgment around how the data could be computed,” said Mahalakshmi Srinivasan, a master’s degree student in analytics who volunteered with the research group.
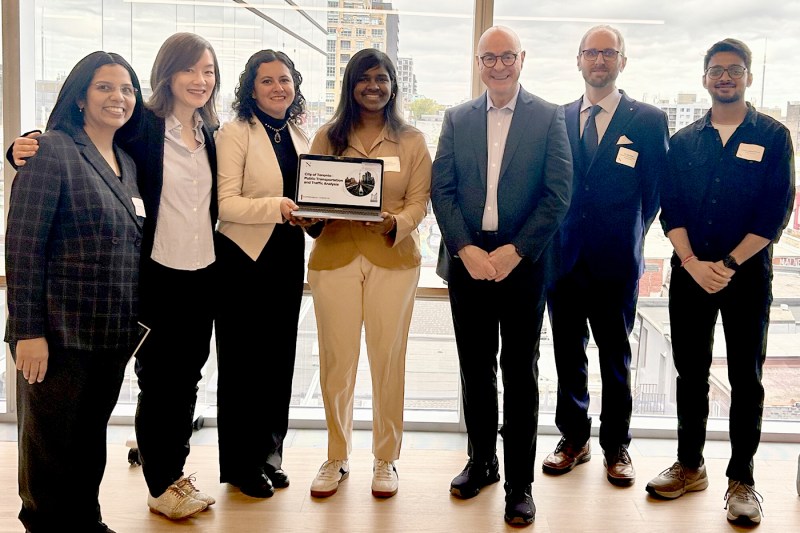
They presented their findings to the city in October in the form of a report for the traffic management team.
“This new capability from Northeastern and TELUS enables Transportation Services to estimate modal split and assess the effectiveness of travel demand management strategies with unprecedented accuracy and speed, enabling a more data-driven approach to supporting large-scale events,” said Roger Browne, director of traffic management. “This technology and data analysis approach is now being used to estimate travel patterns on how people get to regular recurring major events. This initiative has provided valuable travel behavior data that will help inform the city’s travel demand management strategy as part of the overall Congestion Management Plan.”
Editor’s Picks


Browne added that the previous data analysis from the hackathon found 70 percent of attendees used transit to travel to the concert, indicating future public campaigns encouraging people to use public transportation might be effective.
Previously, the city tried to measure people’s travel methods using paper surveys sent to residents, Leung said. But they had minimal responses.
The most recent analysis further confirmed this.
“They actually use real data to perform real analysis for major events,” added Leung, also in the analytics program. “I think that’s impressive.”
The research group came from a hackathon last year where students at Northeastern’s Toronto and Vancouver campuses put their heads together to predict how traffic from Taylor Swift’s Eras tour would impact Toronto.
The city was so impressed with the work that they entered into a research partnership with Northeastern where a team of Toronto students and faculty analyzed past events to further understand traffic patterns within the city.
“(The city) wants to show what is possible with this data,” said Wilder, who teaches analytics. “It’s being used to measure how people move. The longer-term goal is to find a way to see if advertising campaigns help increase subway usage. We want to be able to use this as a benchmark.”
Leung said that the research group would love to help the city manage traffic for future events, like the upcoming FIFA World Cup. She also aspires to work with other companies to get different sets of data. The city would love to know how many people walk or bike to a venue, but that is something that’s hard to distinguish without more information.
“The biking and walking are not easily distinguishable from the cellphone patterns,” she said.”So we need to rely on other external data to tell us about bike rentals. If the city has more requests like this, we can generate different methodologies to give them some insight.”