How a Northeastern professor is using big data to address urban inequities

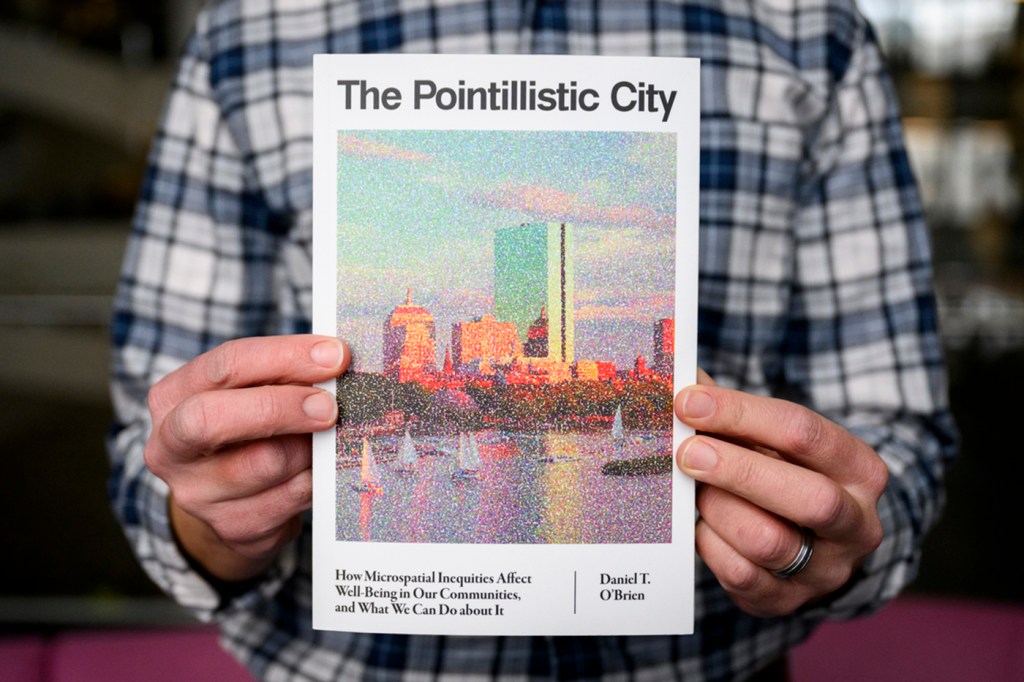
What do you see when hundreds and thousands of tiny dots are positioned together?
Painter George Seurat saw a Sunday in a park in the middle of the Seine river.
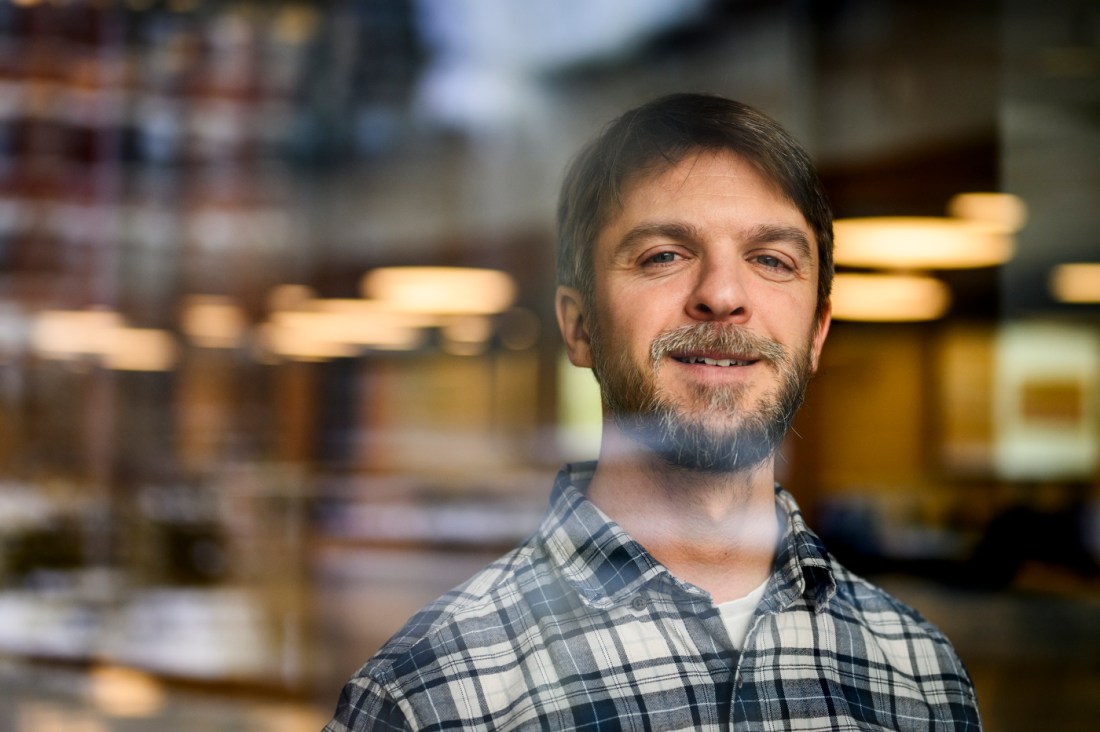
Northeastern University professor Daniel O’Brien sees a city.
“We live at multiple geographic scales at the same time — your property, your street, and as you move up you’ve got the neighborhood, the whole city and the region — and that’s a lot like the way a pointillistic painting is organized,” explains O’Brien, a professor in the School of Public Policy and Urban Affairs and the School of Criminology and Criminal Justice.
“It’s dots that come together to form objects and those objects are organized to form the full image,” he says.
It’s kind of a metaphor, O’Brien says.
“Zooming in or out from a thing are all essential to understanding the full picture,” he continues.


O’Brien is the author of “The Pointillistic City,” a new book from MIT Press.
He is also “a big data guy” and — as director of the Boston Area Research Initiative — a leader in the field of urban informatics, which uses large data sets to both learn about and better serve communities.
But O’Brien says that while much of the data is available at the more granular level — for instance, data examining individual properties — urban science and local policy most often focus on the neighborhood level.
“It overlooks the fact that even within a neighborhood, you can have real disparities,” O’Brien says. “Neighborhoods matter, but the street matters, too, and so does your building, and so does the city that you live in versus another.”
O’Brien calls these disparities “microspatial inequities” and illustrates their importance with his experience collaborating with the city of Boston’s Problem Properties Task Force.
This effort began around a decade ago and focuses on addressing properties that the city has designated “problems” due to factors including violations related to building, housing and sanitary codes, the number of calls to the city’s public safety agencies, and other city incident reports written about the property over the prior 12 months.
Interestingly, O’Brien did not at first think the focus would be successful — believing any crime at the properties would simply migrate elsewhere in the neighborhood.
Editor’s Picks
“I was wrong in the sense that properties clearly had concentrations of crime and seemed to be independent of their neighborhoods,” O’Brien says.
Indeed, researchers found that the intervention reduced crime and disorder relative to comparable matched properties and at adjacent properties for many years.
The book also examines microspatial inequities through an environmental justice lens, detailing O’Brien’s work with local community-based organizations to install sensors on local streets which monitor and track heat and air pollution.
The local community groups can then take the data collected and advocate for interventions.
“We’re putting that information in the hands of the community so that they can determine what action and advocacy looks like for them,” O’Brien says. “We’re using the insights about microspatial inequities to guide a new model for intervention that’s science-driven and community led.”
And that community support is crucial to addressing microspatial inequities — after all, who knows about a community better than its members?
“We need to integrate the scientific side or the big data side with the community perceptions to get to these community-led science-driven approaches to policy and practice,” O’Brien says. “That’s the only way to capitalize on the insights of the book. That’s the only way to really address microspatial inequities effectively.”


