Charting the new course of science mapping
The 1736 “New Map of the Whole World,” created by Dutch cartographer Herman Moll, represents California as an island and outlines only a portion of Australia (then called New Holland), the southeastern corner of the continent drifting like a wayward castaway in the middle of the Pacific.
In a recent Meet the Authors talk in Snell Library, Katy Börner — author of “Atlas of Science: Visualizing What We Know” — said, “The first maps of the planet were not perfectly correct … I would argue we are in the same state of the art in the mapping of science.”
She noted that the visual language used by cartographers in the early days of geographical mapmaking were not yet fully developed nor standardized. Today, science mapmakers are treading similarly uncharted waters as they work to define what it means to visualize science.
As Universities Libraries Dean Will Wakeling said, Meet the Authors events “act as a stimulation for conversation across campus.” This talk was no exception: Börner curates a traveling exhibit called “Places and Spaces: Mapping Science,” which attempts to make science mapping accessible to the general public. The exhibit arrived on campus last week, and Wakeling called it “the essential complement to the book.”
There will be an opening reception for the exhibit this afternoon at 4:30pm in Snell 421. Additionally, the Library is developing a series of related programs and events, including a “do-it-yourself-science-map” workshop.
Historians and scientists have used diagrams and other visual elements to illuminate the interconnectedness of research and data for nearly a century, but science mapping is only now emerging as an autonomous field as data generation rises exponentially and computer technologies capable of analyzing all of it are developed.
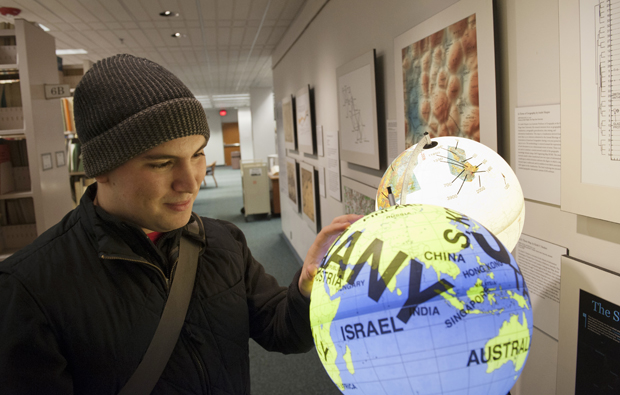
The exhibit, a series of science maps and globes on display in Snell Library, Gallery 360 and International Village through the end of March, presents maps and globes created by artists and scientists alike. Among them are Northeastern professors Alessandro Vespignani and Albert-László Barabási and research scientist Maximilian Schich, who works with Barabási in the Center for Complex Network Research; Schich will give a short discussion of his mapmaking work at today’s event.
“Places & Spaces” maps range from an artful model depicting the distribution of patents across the globe to a scatter plot of the various scientific research disciplines and how they interact with each other based on paper citations.
As David Lazer of the College of Computer and Information Science and the College of Social Sciences and Humanities said in his introduction to Börner’s lecture, science mapmaking is “a remarkably beautiful way of illuminating heretofore invisible processes.”